Tools used today:
http://mindmeister.com/ - mindmap
http://lms.asknlearn.com/moe - discussion
http://www.prezi.com/ - presentation
Activity 1
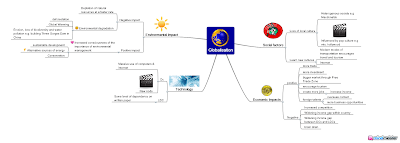
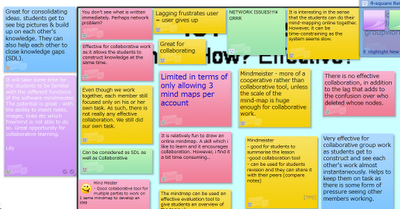
We tried mindmeister on the topic of globalisation. This is much better than Freemind in that images, notes and links can be inserted. The members of the shared map can work collaboratively in creating the mindmap. You can create the icon on the bottom menu (1st icon on left)- toggle on the history of the creation of the mindmap.
Teacher can track the process by looking at the history. Teacher can also track who has contributed to the mind map. The students can revisit and work on the map again. The teacher can also create a template for the students to work on. Allow collaboration, sharing, changes and improvements to be made.
Question of assessment?
Challenges: Bandwidth, logistics, booking of computer labs, back-up plan e.g. worksheets, classroom management.
Part of ICT training rather than subject time - so that they are familiar with it and they can anchor and apply in other subjects.
Webspiration - advantage - many ready templates for use. Allow the students to work collaboratively - like a whiteboard. It can be embedded and exported as well. The map can be shared and embedded in blogs or websites. It can also be exported in pdf or gif format.
 Activity 2: Forum discussion
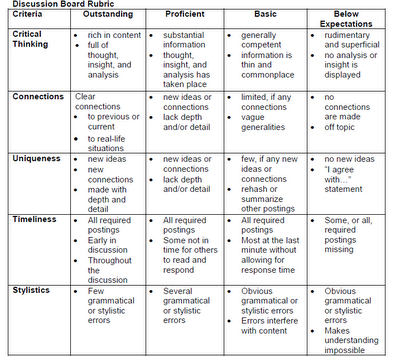
We tried this on the asknlearn platform. The teachers can export the discussion in excel format and do the grading with the rubrics generated from
Rubistar.
Threaded - can see who responded. Allow students to think and post at their own pace with thoughts. Spell check function. Teacher can remove post or ban user.
Challenges - motivation, time-consuming
Source/ pictures as a stimulus, graded
Classroom opportunities or out of the classroom context.
Activity 3:
We made use of prezi for the presentation of a personality linked to globalisation. Our group worked on Mark Zurkenburg, the founder of Facebook.
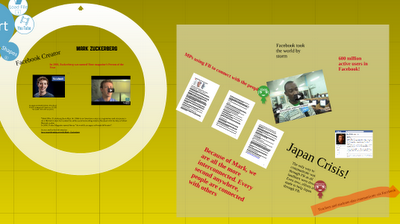
Other presentation tools includes animoto, photostory 3, VoiceThread, Acapela.tv, comic strips such as toondoo and bitstrips
Additional Resource:
You may find additional lesson resources on globalisation in edumall shared and uploaded by CPDD. Please access edumall here.
Lesson Package on Airbus (104.2MB) includes video http://library.edumall.sg/cos/o.x?c=/library/reslib&uid=&ptid=84&func=view&id=52096&fext=.zip
Lesson Package on Kyoto Protocol (114.5MB) includes video http://library.edumall.sg/cos/o.x?c=/library/reslib&uid=&ptid=84&func=view&id=52095&fext=.zip Short Clip on iPod (video) http://library.edumall.sg/cos/o.x?c=/library/reslib&uid=&ptid=84&func=prop2&id=43907
There are other resources on weblinks and newslinks, etc. at the site.
Other resources
1. You may want to refer to the Language Page for additional resources here
2.
Cooltoolsforschools
3.
Cool tools - educational games
4. Bloom's and ICT tools
5. Simple K12
Here are some other more popular online rubric makers
http://www.teach-nology.com/web_tools/rubrics/
http://www.rcampus.com/indexrubric.cfm


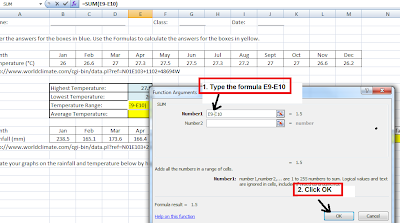
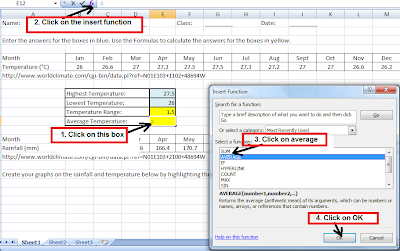
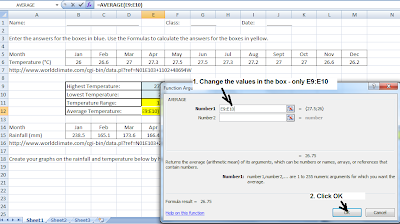
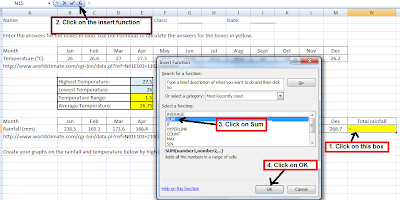
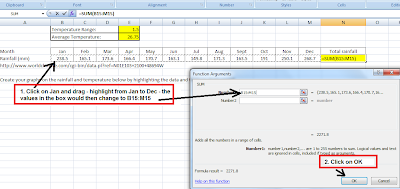


 Creating a rainfall graph with Chart Wizard


