Oct 14, 2013

Infogr.am

You can find out the distance of the country of the origin of the tourist from Singapore here:
Create an account @ http://infogr.am/ - click on "create" and then click on any of the infographics template. 


Double click on the text box and type in your title

Delete the chart and add a new one by clicking on "add chart" as shown below.

 Choose the type of graph you want your data to be represented.


Double click to edit the chart.

Clear all the data.

After you cleared all data,  open the excel file as shown below. Copy and paste the data back to infogr.am


You can also create a map with the same data - click on "add a map"


Aug 27, 2013

Using Google Map to represent data

To find the latitudes and longitudes of sites which you are collating the data - log onto to Google Map, right click on the location of the site and then click on the green marker and the latitude and longitude will be shown.
 
The following are the various sites in my school.
 
 LatitudeLongitude
Parade Square1.37523103.902154
Field 
1.374803
103.901546
Pond1.374768103.902581
Canteen1.37479103.902141
Basketball court1.374162103.902117
 
A google form is generated for the group to enter the respective data they have collected:


The data which the group enter will appear on the spread sheet in Google Doc. Download it as a csv file.
 
Go to https://mapsengine.google.com/map/u/0/ and click on "new map"
 Click on "import"   

Import the csv file which you have downloaded earlier.


 Click on" Lat of Location" and a pop up menu will appear - click on "Latitude"
 
  Click on" Long of Location" and a pop up menu will appear - click on "Longitude"

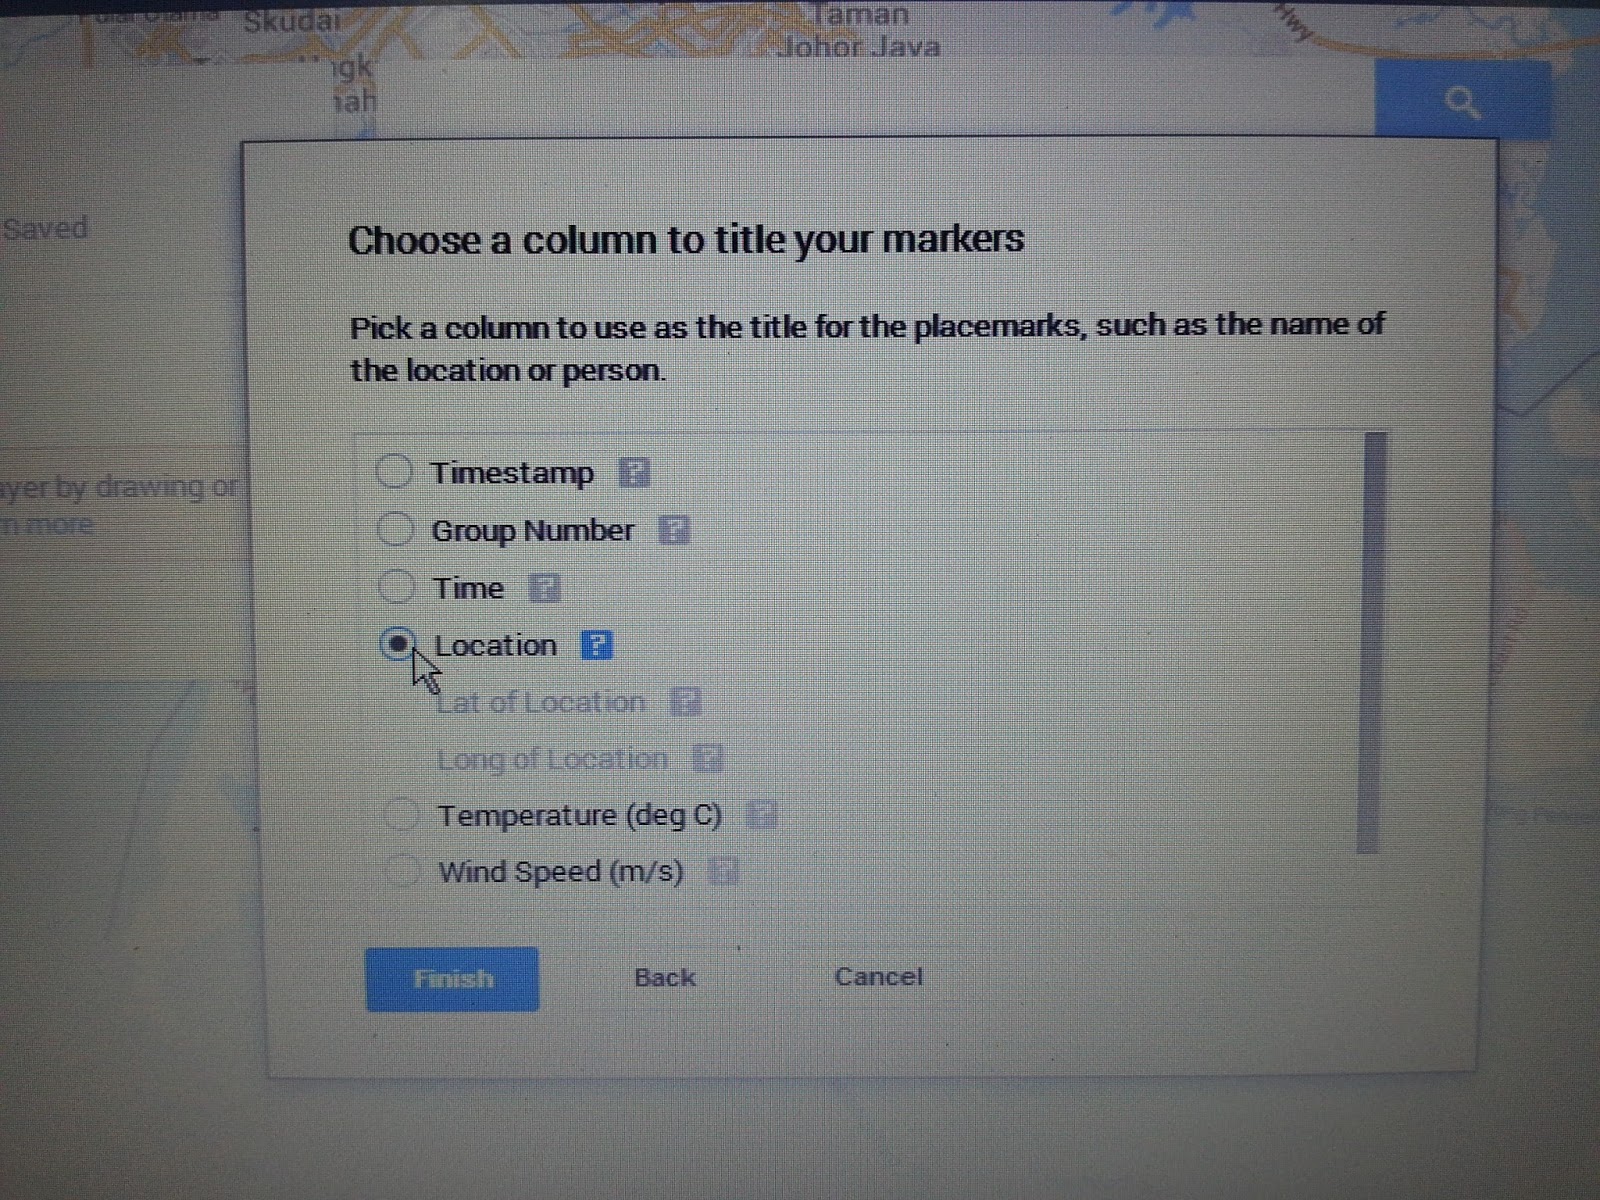
Click on "continue" and then click on " Location" and "Finish"

 
 Click on "style" to customise the appearance of the layer features on the map.
 
Click on the arrow key next to "base map" and choose "satellite" from the pop up menu.


Click on "style" then "individual style" and click on "temperatures" 
 
 You can then click on "ranges" and the colour you like to represent the temperature.
 
You can click on "data" to view and edit the data.


Jul 28, 2013

Popplets


Create a mindmap using popplet on the hazards associated with earthquakes. 

Create a new account with http://popplet.com – then create a new popplet.

Click on the 'A' icon at the bottom of the popple to type. You can also change the colour of the popple. Click on the circle at the sides of the popple to make new links. You can insert pictures or even youtube video by clicking on the picture icon at the bottom of the popple. You can extend your popple by clicking on the triangle on the four corner of the popple.
 

Remember to save the file.  You can export it as a pdf or jpeg file.


To encourage Collaborative learning - you can get the students in groups and then get the team leader to invite the team members to collaborate. The collaborator names will appear on top of the popple  they created.

You can even click on lab - show timewarp to see the process of collaboration - ie - time in which collaborator contribute a certain point.

Jul 11, 2013

Classroom Dojo

My colleage, Ms Ho, shared an interesting behaviour management app known as Classroom Dojo with us. No downloading is required. All you need is an email to register and you can access it using iphone too. You can create avatars of your students and affirm them for positive behaviour in class by awarding points.They will be able to see immediately why they have been awarded a point, i.e. Participation, Helping Classmate etc Essentially, it also allows students to regulate their behaviour in class.
 
To find out more about its functionalities, go to http://www.youtube.com/watch?v=KaeNSYJvrn0
or register at www.classdojo.com
http://www.youtube.com/watch?v=KaeNSYJvrn0

You can also visit her blog to find out more about how it is used:
http://beworldlywise.blogspot.sg/2013/07/classdojo.html

Jul 10, 2013

Google Earth - Tectonic Plates


Kmz file on Tectonic Plates - please ensure you have already downloaded Google Earth. Click and expand Places on the side menu on your left. You should see the placemarks 1 to 6 classified under the 3 types of plate boundaries. Double click on each placemark to find out more about the landforms formed at the respective plate boundaries.
Animation on labeling parts of a composite volcano: - this will help students understand the parts of a composite volcano better.

 The worksheet for the lesson :You might want to also check out the following animations on how volcano and crater lake are formed. 
Volcano
Crater Lake

You can also access the following to better understand types of volcano and damage from earthquakes.
Interesting flash on making your own volcano - understand the difference between a composite and a shield volcano 


Jul 4, 2013

Blogging as a tool for updating information, sharing and a reflective practice


The slides for my presentation on blogging today at the N3 ICT symposium -Pei Hwa Secondary School.

Jun 27, 2013

ICT Mentors Workshop - Co-creating a Participatory Culture 27 June 2013

Learned a lot in the workshop from Kim McMonagel who is so passionate in sharing  and creating a virtual networked learning community

I like her idea of a Tec Bingo - I could adapt this and use it with my class - getting them to prepare themselves before the class in a fun way. Response can be collected using Google form. This is in-line with the idea of a flipped classroom – pre-workshop/pre-lesson reflection – opportunity to explore before workshop/lesson.


Explore Coaching & PLN Resources -


Play TEC B-i-n-g-o!
Exploring two to three resources in a row takes about 20-30 minutes of your time.
Earn blackout when you explore ALL the resources; it takes longer but the wealth of information will inspire a plethora of new learning opportunities. 
T
E
C
Visible Thinking Routines -support reflective practices for all learners.
All things PLC - designing a digital Professional Learning Community


Subscribe in iTunes to the #Edchat Radio


FREE SPACE
Why educators should be collaborating  - interesting article.
Tips from Brown University


Like the online stopwatch which she used to time us for the activity
Though I must say it is quite stressful getting work done in 5 mins.

I totally agree with what Kim mentioned about time to be given for reflection and to read other’s responses–  there is a need for learner processing time
e.g.  issue resources for them to read on Mon and to reflect by Wed. Link to responses given to students on Wed and then class discussion on Friday on the responses.
Deep thinking and reflection before class

 Another interesting tool - Using tagexedo to form word cloud with style -
http://www.tagxedo.com/  I have created one using this blog:


ICT Tools listed by ICT Mentors During the Webinar -will try to explore some which I have not really done so (I have already tried out those highlighted which I have shared in previous post):
1.     Bit strips for schools - comic strip creation
2.     Blogs
3.     chemistry videos in youtube
4.     Classtools
5.     Diigo
6.     Doodle
7.     Dragonwise
8.     Edmodo
9.     Garageband on iPad
10.  Geogebra for maths
11.  Glogster
12.  Google doc
13.  Google Map
14.  GSP for math
15.  http://www.epals.com/
16.  http://www.scoop.it
17.  Ipad apps
18.  Jamendo
19.  Learning Management System (LMS) e.g. McOnline, AsknLearn
20.  'learnist'
21.  linoit
22.  mathplayground for videos on mathematics topics
23.  mindjet
24.  mindmeister
25.  Moo-o
26.  Newsmaker
27.  Online mindmaps
28.  Online whiteboard
29.  phet simulation for chem
30.  phet simulation for Physics and Chemistry
31.  Pinterest
32.  Podcast
33.  Poll everywhere
34.  Popplet
35.  Powerpoint
36.  Present.me
37.  Prezi
38.  Primary Wall
39.  Quipper quiz
40.  Socrative
41.  Scoop.it
42.  Screencastomatic
43.  Sribblar
44.  SMART notebook
45.  smartphones apps
46.  Socrative
47.  Story bird - writing stories with pictures - collaboration with others
48.  Storymaker
49.  Symbaloo
50.  Tedlessons
51.  Titanpad
52.  Today's meet
53.  Toondoo
54.  Vocaroo
55.  Voicethread
56.  Wallwisher
57.  What's app
58.  Wikispace and online mindmaps
59.  Word cloud
60.  Wordle
61.  Youtube

Kim has encouraged us to form our communities (Personal Learning Network) on OPAL for greater collaboration. We can post a question and get the rest to respond which would just take 15 mins or so every week e.g. How to use diigo..
 For those who missed the webinars-
1
Webinar Session 1 archive
2
Webinar Session 2 archive
3
Webinar Session 3 archive

May 29, 2013

powtoon - creative online presentation tool


http://www.powtoon.com/home/

One of my colleagues used this online tool for her presentation today - impressive! Sharing with all - awed your audience with your presentation using this tool! Students will find creating their presentation more exciting too. A sample on climate change shown below:


Apr 6, 2013

sharing on the use of blogs

Quite glad that a few teachers I met @ the humanities network sharing have already made use of the resources I put up on my Geography Blog.
It has also been very encouraging to know that a number of teachers have been inspired to start blogging after visiting mine!
My presentation slides below:

Feb 7, 2013

Glogs - High-tech farming

The students were asked to design a glog to present on high-tech farming in Singapore. They were expected to insert a video, at least a photo and write-up on how aeroponics is carried out and why high-tech farming is suitable for Singapore. I have used linoit below for them to post the links to their glogs. The links had also been sent to my email under notification from linoit. Here the students can also do a virtual gallery walk by visiting the glogs created by their peers.
As mentioned in my earlier post. The use of Glogs encourage students take pride in their own creation and motivate them to learn further. There is SDL as the students can continue to research and learn beyond the classroom.

2H4 - post the links to your Glogs here:


2H7 - post the links to your Glogs here:


I have also used it as a tool for instruction - teacher create the glog with all the links such as videos, forums, reflections etc on the glog. e.g. Glog on Bursting Stereotypes. Tried it out myself for the VE lesson on the topic Integrity a few years back using glogster and google doc for the form: http://www.glogster.com/mrslilylee/integrity


As mentioned the students' responses are captured on the form which I have created on my drive (ICON) and I can easy view the individual response or see the summary of response as I did above. It also save on paper and I could view their responses anytime, anywhere!