
Data on Singapore's temperature from:
http://www.worldclimate.com/cgi-bin/data.pl?ref=N01E103+1102+48694W
Data on Singapore's rainfall from:
http://www.worldclimate.com/cgi-bin/data.pl?ref=N01E103+2100+48694W
Calculating Temperature range:

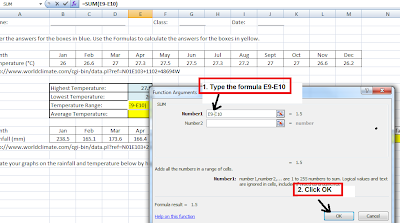
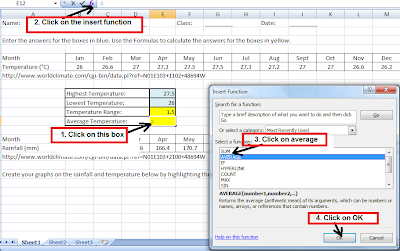
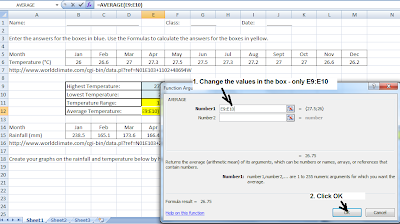
Calculating average temperature:
Calculate total rainfall 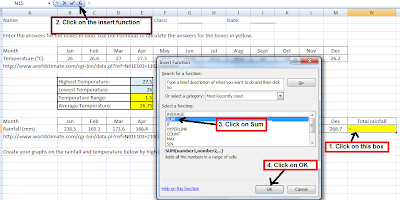
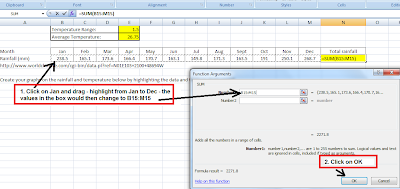
Creating a temperature graph with Chart Wizard:


 Creating a rainfall graph with Chart Wizard


It is also simple and useful especially when you have two sets of data for the Y axis. As shown below - air temperature and relative humidity.

No comments:
Post a Comment