Added on how to use the combo chart to create climograph as well using secondary data from worldclimate.com
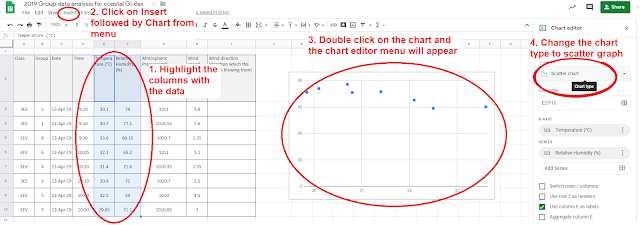
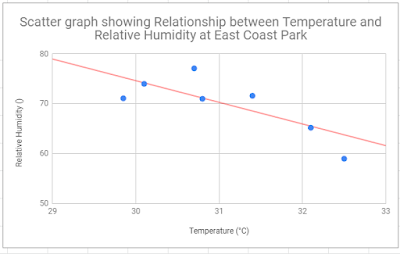
Creating Scatter graph with best-fit line
Creating a Comparative Line Graph using a Combo Chart with two Y-axes
You can also use this function to create a climograph. An example -https://docs.google.com/spreadsheets/d/1Y0jjusBUyi8RbZIkiZvlfngDb_DPnLXJdrc-W6fyn1A/edit?usp=sharing
You can get the rainfall and temperature data from http://www.worldclimate.com/
Coastal GI at ECP - https://sites.google.com/a/moe.edu.sg/sec3geog/geographical-investigation/gi---coast/gi-coast-2016
The spreadsheet which I have created:
https://docs.google.com/spreadsheets/d/1a-Y2IITjjxB6W9FmZmf5KDAhHp0EJApaf-qNT95FDwM/edit?usp=sharing


No comments:
Post a Comment