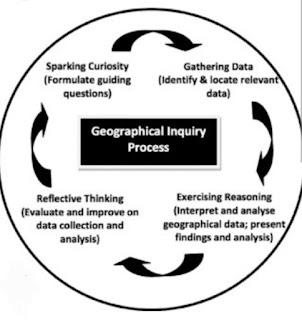
Decided to carry out an inquiry-based learning on Geographical Methods under the topic Geography in Everyday Life in the new Upper Sec Geography syllabus.
We had always been using the inquiry-based learning in our Geographical Investigation. As we have completed the part on how nature benefitted people by lowering ambient temperatures via evapotranspiration and shade, I wanted to sparkle their curiosity on whether vegetation and shade has an impact on temperatures within the school compound.
A good trigger in SLS Activity A under Geographical Methods, prompting them to think of the research question and hypothesis which they can use in the fieldwork in school. The students added crafted the research question and hypothesis using the interactive thinking tool in SLS. The teacher and peers commented on the hypothesis, especially whether it contains two measurable variables which they can use to test the hypothesis. There is promotion of thinking and discission.
The instructions were given in Google Classroom which I have attached a Google spreadsheet which the groups can collaborate in the collection of data and analysis. The advantage of attaching the Google spreadsheet in Google classroom is that I can choose the option of them being able to edit as a group. I do not need to add sharing rights to individual student. If there are other teachers in the group, they will be added too. This promote collaborative learning as the groups collected more data which they can analyse and interpret together.
Each group recorded the data they measured and observed on the respective tab on the spreadsheet and I could see their live updates in class when they were at various spots collecting the data. I have projected the spreadsheet onto the screen and transferred their temperature data onto the whiteboard. That was when I noticed one group's data was quite off at 22 degree Celsius plus whereas the rest ranges from 26 to 27.6 Celsius degree. Halfway transferring the data, I saw the data being erased and the new ones recorded were above 26 degree Celsius. The group input the data collected to their respective tab in the Google Spreadsheet and will instantly show on the main page (first tab).
The new syllabus did not really prescribe any GI but it also give rise to opportunity for the students to engage in a more authentic learning environment by deciding what they want to investigate.
Another class' analysis on the bite-sized fieldwork 22 Mar 2023. I changed one location from guard house to the bamboo garden. Another anomaly was spotted and the class learned collaboratively as the groups' data were analysis collectively as a class.
One more class bite-sized fieldwork on 29 Mar 2023. They measured the temperatures in the afternoon so temperatures are higher. But we were quite puzzled with one of the recordings at 39.5 degree Celsius which is exceptionally high. Again the idea of an anomaly was brought in and how averaging the data reduce the anomaly. Teachable moment.
A copy of student's Google Spreadsheet:
My Reflection
𝗛𝗼𝘄 𝗱𝗶𝗱 𝘁𝗵𝗲 𝘂𝘀𝗲 𝗼𝗳 𝘁𝗲𝗰𝗵𝗻𝗼𝗹𝗼𝗴𝘆 𝗲𝗻𝗵𝗮𝗻𝗰𝗲 𝘀𝘁𝘂𝗱𝗲𝗻𝘁𝘀' 𝗹𝗲𝗮𝗿𝗻𝗶𝗻𝗴 𝗲𝘅𝗽𝗲𝗿𝗶𝗲𝗻𝗰𝗲?
The interactive thinking skill tool in SLS allowed the students to process and improve on their answers based on the teacher's feedback. It also allowed thinking to be made visible. Key Application of Technology: Assessment for Learning
The students were able to work on the collection and analysis of the data collaborately with the use of the Google spreadsheet. Key Application of Technology: Learn together
The use of Google Spreadsheet also allowed them to represent the data instantly with a bar graph through inserting a chart instead of drawing on paper. Important points such as title, labelling of axes as well as the values on the axes can be taught. They have also learned the skills of using a spreadsheet.
Through the inquiry-based learning, students learned in an authentic learning environment and not just facts from the teachers or textbook. They have learned that mistakes made can be a learning point too.
𝗪𝗵𝗮𝘁 𝘄𝗲𝗿𝗲 𝘀𝗼𝗺𝗲 𝗹𝗲𝗮𝗿𝗻𝗶𝗻𝗴 𝗱𝗶𝗳𝗳𝗶𝗰𝘂𝗹𝘁𝗶𝗲𝘀 𝘆𝗼𝘂𝗿 𝘀𝘁𝘂𝗱𝗲𝗻𝘁𝘀 𝗳𝗮𝗰𝗲𝗱?
As the students were given the task of crafting their research question and hypothesis on the ITT pre-lesson, there were a number of students showing difficulties in managing that. I had to clarify points such as whether there are 2 variables which can measured and whether it is feasible to be carried out in the school.
They were not able to change the minimum and maximum values for the Y-axis on the Google spreadsheet using their iPad so they actually changed it on my desktop.
𝗛𝗼𝘄 𝗺𝗶𝗴𝗵𝘁 𝘆𝗼𝘂 𝗺𝗼𝗱𝗶𝗳𝘆 𝘁𝗵𝗲 𝗹𝗲𝘀𝘀𝗼𝗻 𝘁𝗼 𝗵𝗲𝗹𝗽 𝘁𝗵𝗲𝗺 𝗰𝗹𝗼𝘀𝗲 𝘁𝗵𝗲 𝗹𝗲𝗮𝗿𝗻𝗶𝗻𝗴 𝗴𝗮𝗽?
I would give more scaffolding for the ITT task before using it as a trigger.
I have actually modified the lesson twice. One to change one of the sites to a more suitable location and second to auto reflect the group's data onto the main spreadsheet.
The above was what I adapted from the old syllabus weather GI: https://geogshare.blogspot.com/2021/05/blended-learning-for-gi.html


No comments:
Post a Comment