May 22, 2021

HBL morning meet

Definitely benefitting from the sharing in SGLDC and by my colleagues as I used it for my morning meet with my form class, making it more effective.

1. Attendance and temperature taking using Google Form and spreadsheet

Shared by Yong Qin in SGLDC, he had created a Google Form and Google Spreadsheet which simplified the process of taking the attendance and temperature taking. 

The form helps to track the following: students who have/have not taken their temperature students who are late students who are not feeling well because they have a fever or because of other reasons. 

The form accepts input every day, so there is no need to maintain the form after you have set it up. I

His video demonstrating how the form works and how you can copy the form into your Google drive here

 https://www.facebook.com/groups/sglearningdesigners/permalink/1108342616320248/

 The links to the files are shown here: https://drive.google.com/drive/folders/1ugB3_EeBlSyCZzHI7FlLtU3ZVB4ETcOJ?usp=sharing 

Grateful to him and tried it out. It works!

2. Using padlet for bonding activities.

Motivating them to be early with mini challenges between 7.30 to 7.45am as they are supposed to log in at 7.45am. The students could also draw or design quizzes for their classmates.


May 21, 2021

Google Jamboard

This was shared by my colleague, Addie, by email that Google Jamboard had been added into the Gsuite family for my school.


Addie also shared on the technological affordance of Google Jamboard.

Technological affordance

- Google Jamboard allows our students to have real time collaboration in sketching.
- It is compatible with the student's Apple pencil and iPad.
- User friendly and initiative. The sharing feature is similar to any of the other google apps such as google docs and google classroom.


Addie shared on how it can be used for students to annotate or label on given diagram. Individual slide of a graph could be assigned to each student and the teacher could see the thinking process of each student in analysing and interpreting the graph. He also mentioned a very useful strategy at the end of the video how you can use it to better see the students understanding of the lesson and also able to match the students for peer support using the post it function. Check it out! There could also be group collaboration using the jamboard to co-create an idea or design.

I find this especially useful as it can be accssed via Google meet. I love to model for my students how they can extract information from data given in order to apply it to the question asked. I have been using Paint but this seems to be good as I can insert all my data (photo, chart, maps etc) into the various pages on Google Jamboard which can be accessed easily during the Google meet.
 

Tried the jamboard with a Sec 1 class. It's good in that the students are more engaged as some can be tasked to label on the diagram to check their understanding. However I seemed to have a playful one who tried to doodle on the image as well. You can see that one of the students have chosen to type the answer. However some could not access via the Google meet and I should have send them the direct link to the jam board.

Updated 7 July 2021
 I like how a Chinese teacher, Francesca,  gotten the students to work in pair. Each pair work on a poem as there is a maximum of 20 pages per jamboard. A great way to collaborate and learn!


May 15, 2021

Game models

Awesome sharing by Lawrence in SGLDC.

New board game based on idea from flippity. He added ability to auto-move so that the game is more pedagogically based on teacher's questions added. You only need to type in your own questions and customize to suit your SLS lesson. 

https://ejss-browser-editor.herokuapp.com/ 


You can try out the one below: https://iwant2study.org/lookangejss/EditableSimulations/ejss_model_Board_Game/ 


Apr 22, 2021

Google Earth for History

 I think it will definitely engage the students with virtual overseas LJ using Google Earth.

Under Culture in Voyager, students can choose to visit the WWI sites and learn more about the events there. Below are screenshots from the Voyager in Google Earth on WWI: Around the Globe. A collaboration with History Channel. 


Under Street View in Voyager, explore 360 views of WWII Memorials around the world!


Test your knowledge of the battles and events that took place during WWI and WWII using Google Earth. Visit the Places using the placemarks.


Apr 17, 2021

Timelapse on Google Earth

Excited that timelapse can now be viewed on the Google Earth app. I have always love to show the students how changes occur over time using the time slider on the desktop Google Earth. Now students can explore timelapse on their iPad too!

To explore Timelapse in Google Earth you can access the tool directly by going to g.co/Timelapse   or you can open Google Earth app.
  1. Click on the "Voyager" button in the toolbar (the button looks like a ship's steering wheel).
  2. From the "Voyager" screen you can now click on the tab for "Timelapse in Google Earth".
  3. This will now open the Timelapse feature in Google Earth, which includes the Timelapse panel on the right side or at the bottom depending on your device.
  4. You can type in any location on Earth that you would like to explore in search.
  5. Or click on the "Stories" tab. Here you will find guided tours that will take you to locations around the world where you can explore the changes through Timelapse. The stories include "Changing Forests", "Fragile Beauty", "Souces of Energy", "Warming Planet", and "Urban Expansion".
  6. Or click on the "Featured Locations"  where you will find collections of locations around the world in categories such as "Agriculture", "Deforestation", "Glaciers", "Infrastructure", and many more.
Search Locations and Stories


Featured locations


In addition to the Timelapse feature inside of Google Earth, Google has also created a site with over 800 prerendered videos of timelapses from all around the world. You can access these at http://g.co/TimelapseVideos

A tutorial on the Timelapse feature in Google Earth


Information from

Apr 14, 2021

Music Lab on Chrome

 This sharing on music lab is great!

https://musiclab.chromeexperiments.com/Experiments


You can get the students to create and save their song. https://g.co/songmaker
No need to download and it's free!


Apr 13, 2021

Flippity games

Gotten my students to create this using randomizer.

Then they played with the ones designed by their peers and created stories with the random phrases. They had a good laugh.


On another session gotten them to put their names and action to be done on a bonding activity using randomizer.


Many other games which they can create at

https://www.flippity.net/

Click on the label flippity below for more.

Updated 21 Apr 2021:

A sharing of a Jeopardy-style gameshow using flippity by Andy in SGLDC on Chemistry: Group 2 elements and compounds 

https://www.flippity.net/qs.php?k=17148Vl3J4Zy-3ChNdacBraQjEfTk1CdeQxVVsiA7oto


Harley designed one for CL on the matching game

https://www.flippity.net/mg.php?k=16r_Y3uU-NOVU8o12IBsWEYYU3HK_9FpwTDkOknVr_Dc

 
You can see more on flippity by clicking on flippity label below

Apr 7, 2021

Share a sheet

 Just learned which will come in handy.

How to share a sheet without sharing the whole file?

Remember to click on allow access when the error message appear after you entered the above formula


More on Google Classroom

I shared last year how I have gottten the students to write the HBL journal using Google Doc. I assigned it in Google Classroom and made a copy for each student. They could color and write on the doc. I supposed they could do so as the image was inserted into the Google Doc I had created for them.

The students definitely could type on Google Doc. You can see below that they have typed their answer below the questions. I would then open it up in Google Classroom App my iPad or Samsung Note to mark it just like I would on paper.


Rich text formatting is available Now!


What I do presently to enhance the text without the rich text formatting was either to highlight the text and press ctrl+U to underline or ctrl+B to highlight. I could also generate fancy text using the following website and then copy and paste: https://lingojam.com/FancyTextGenerator


Apr 1, 2021

Google Earth for Geography

 We opened our classroom for teachers from another school to show how our students used their personal learning devices in class. 

We had started on 𝟭:𝟭 𝗣𝗲𝗿𝘀𝗼𝗻𝗮𝗹 𝗟𝗲𝗮𝗿𝗻𝗶𝗻𝗴 𝗗𝗲𝘃𝗶𝗰𝗲 using iPad in 2019 and it was a real blessing for 2010. I must thank our HOD ICT in rolling out the 1:1 PLD program and also ensuring the infrastructure support such as 𝗔𝗽𝗽𝗹𝗲 𝗧𝗩 so that we can mirror our iPad screen to the projector screen easily. 

Of course I am also thankful that we are already on the 𝗚𝗼𝗼𝗴𝗹𝗲 𝗦𝘂𝗶𝘁𝗲.The ease of organising the lessons via the 𝗚𝗼𝗼𝗴𝗹𝗲 𝗖𝗹𝗮𝘀𝘀𝗿𝗼𝗼𝗺 and the ability for the students to use technology in their learning. The Sec 3 had fun on an overseas virtual fieldwork in UK and made interesting findings on 𝗚𝗼𝗼𝗴𝗹𝗲 𝗘𝗮𝗿𝘁𝗵. The Sec 1 love that they can explore the field sites along the Punggol waterway from their seats using 𝗚𝗼𝗼𝗴𝗹𝗲 𝗘𝗮𝗿𝘁𝗵. They would have gotten all wet if they had gone there for their GI as it started raining so heavily. 

Sec 1 

We completed stage 4 of our Water GI using 𝗚𝗼𝗼𝗴𝗹𝗲 𝗖𝗹𝗮𝘀𝘀𝗿𝗼𝗼𝗺, 𝗚𝗼𝗼𝗴𝗹𝗲 𝗘𝗮𝗿𝘁𝗵 as well as 𝗚𝗼𝗼𝗴𝗹𝗲 𝗦𝗹𝗶𝗱𝗲𝘀 for collaboration. I have placemarked the field sites and embedded the data they had collected from their water test. The groups entered the data into 𝗚𝗼𝗼𝗴𝗹𝗲 𝗙𝗼𝗿𝗺 and the teachers were able to help the classes collate their data for the to analyse on the 𝗚𝗼𝗼𝗴𝗹𝗲 𝗦𝗽𝗿𝗲𝗮𝗱𝘀𝗵𝗲𝗲𝘁. They were able to make observations of the field sites using the street view and explained how the features they have observed on 𝗚𝗼𝗼𝗴𝗹𝗲 𝗘𝗮𝗿𝘁𝗵 showed human activities and the impacts on the waterway. They are able to collaborate with their members to present the conclusion on their GI using 𝗚𝗼𝗼𝗴𝗹𝗲 𝗦𝗹𝗶𝗱𝗲𝘀. https://sites.google.com/a/moe.edu.sg/sec-1-geog-2021/2021-water-gi 

To show the changes overtime I have also used Juxtapose JS to create a time slider using 𝗚𝗼𝗼𝗴𝗹𝗲 𝗘𝗮𝗿𝘁𝗵 images from 2010 and 2020.
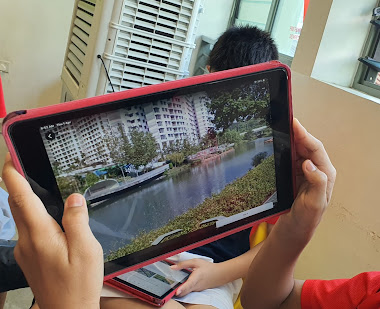

Was a bit apprehensive carrying out the same lesson with a sec 1 NA class but I was so pleasantly surprised that they showed more enthusiasm. As they visited the site using Google Earth, many were excited and asked Mrs Lily, is this the oxygen pump? Is this the aquatic plants that purify the water? Is this the turbidity barrier? Teacher, this construction site has a fence, so the soil will not be washed into the river? Teacher do we only write the bad things which affect the water or we can write on the good ones? Teacher I live there, the construction of the block is already completed, why does it still show a construction site? I was bombarded with so many questions and at the same time feel happy that they are asking questions cos that is part of inquiry based learning. Definitely engaged as they take ownership in collecting the data (evidence) in this geographical investigation. I think it's a joy to see them having fun in learning, discovering more about the environment around them. For this I am grateful with the use of technology. 😊 In fact I learned from them too, as they are so proud of their findings, I get them to screenshot the Google Earth images into their slides as evidence. Original plan was just for them to write on their findings but learned from them that I should let them include as evidence for their conclusion. Will definitely change that for all classes next year.


Sec 3 

We used Google Earth to understand coastal studies for map reading. I have integrated a topographical map into the 𝗚𝗼𝗼𝗴𝗹𝗲 𝗘𝗮𝗿𝘁𝗵 file. The students visited the south of UK (Seaton) and learn how the map representation came alive with 𝗚𝗼𝗼𝗴𝗹𝗲 𝗘𝗮𝗿𝘁𝗵 showing them the actual site of coastal landforms they have studied. They also better understand the concept of space, scale and place as they made measurements of the spit and made observations of how the spit has affected human activities in the area. https://sites.google.com/a/moe.edu.sg/sec3geog/google-earth 

 This was continued from the Coastal GI using 𝗚𝗼𝗼𝗴𝗹𝗲 𝗘𝗮𝗿𝘁𝗵, 𝗚𝗼𝗼𝗴𝗹𝗲 𝗦𝗽𝗿𝗲𝗮𝗱𝘀𝗵𝗲𝗲𝘁 and 𝗚𝗼𝗼𝗴𝗹𝗲 𝗦𝗹𝗶𝗱𝗲𝘀 on 15 Mar. With Google Earth, the students visited the place marked field sites and made observations of the environment. They annotated a field sketch to explain the coastal processes which could have affected their investigation. It is blended learning as I also included the fieldwork simulation of measuring the sediments I had collected. They did the wave frequency via a pre-recorded video. They also measured the gradients on the models I have created. https://sites.google.com/a/moe.edu.sg/sec3geog/geographical-investigation/gi---coast/2021-coastal-gi-fieldwork-simulation

Updated 3 April
Google Earth provides opportunities to explore geographical issues such as Climate Change.
Other than the Google Earth kmz file 4 degrees which shows areas most affected by global warming in terms of temperature changes.

Students can explore cities which will be most impacted by the rise in sea level in the simulation with Voyager in Google Earth
The file on sea level rise and the fate of coastal cities can be found under the category Nature in Voyager.


Showing the spatial extent of impact with a 2 degree increase in global temperature as compared to a four degree increase on Mumbai in India.


Love the 3D enactment of the coastal flooding of the cities with sea level rise.